

Machine data heterogeneity is a major obstacle that prevents factories from optimizing processes and equipment performance, especially when it comes to minimizing downtime.
The data in a typical factory comes from a diverse range of sources, including machines made by many different manufacturers, a dizzying array of component types, and data collected in varying formats and levels of structure. That creates a lot of complexity if you are looking for a specific piece of data around how a certain machine is functioning, or if you want to get a sense of how your fleet is performing over time.
Currently, the intricacy of querying and visualizing the data that diverse hardware generates and collects about its environment places significant hurdles to carrying out routine troubleshooting and repairs, or enabling effective remote diagnostics. As a result, even minor machine functionality issues tend to require onsite intervention, adding to operational burdens.
How do you get the disparate data generated by many different machines to tell a coherent story? Furthermore, how do you glean accurate insights from that story to take action in a way that will make your factory more efficient?
The challenges of diverse hardware in factories
Most factories operate with a diverse array of hardware. They use the best tools for each job, which often means integrating machines from different manufacturers. However, this diversity leads to incompatible devices and data silos, preventing the realization of true smart factory efficiency.
Incompatibility among machines can manifest in various ways. Sometimes, machine operating systems struggle to communicate with each other and require specialized knowledge like programming or querying languages to tap the data from each machine. In other instances, machines produce data in different formats requiring additional processing before analysis. Discrepancies in data granularity, definitions, integrity, and security can also lead to misalignment and erroneous insights, undermining the original purpose of collecting and analyzing data.
Overcoming these hurdles enables you to use machine learning to automate insightful decision-making and improve efficiency across a fleet of machines. Data from diverse machines becomes more usable for actionable insights when those machines are interoperable and their data is accessible and easily shared.
Overcoming the patchwork silos of traditional machine data analysis
Typically, factories will at some point need to integrate their various tools and systems to get a bird’s-eye view of how their machines are doing as a unit to maximize asset yields.
Many of these tools and systems, such as cloud storage or AI, will have been designed for software. Getting these solutions to work with physical devices often involves complex and time-consuming integrations that will still leave significant blind spots.
Each piece of machinery also likely comes with its own proprietary data formats and communication protocols that weren’t designed with the cloud in mind.
This can lead to situations where automated data analysis is prevented by the limitations of incompatible hardware. For example:
- Disparate sensors will leverage a variety of clocks, leading to a lack of alignment on event timelines
- Appliances that lack built-in connectivity will require the use of base stations or SCADAs as proxies for integration into an overall framework
- Variations in sampling rates can lead to inconsistencies that will then need further harmonization for proper data alignment
- Machines with differing communications standards will require translation to ensure consistent data exchange
Put a cloud designed for software together with machines whose systems weren’t conceived with the cloud in mind, and you have a fragmented data landscape that hampers real-time decision-making. It also makes it challenging to get a holistic view of the manufacturing process, which makes it difficult to measure overall efficiency and performance.
Viam’s unique hardware-agnostic approach to machine data
Viam addresses these challenges head-on by providing a unified platform that allows manufacturers to see, synthesize, and take action on all machine data in real time from a single view.
Unlike traditional solutions that require custom integrations and are often dependent on specific manufacturers and their proprietary approaches, Viam offers an out-of-the-box solution that integrates seamlessly with existing machines and their sensors.
Interoperability and data capture
Viam’s approach to interoperability is a cornerstone of its platform. By leveraging Viam server, manufacturers can capture data from a wide range of sensors and devices without needing to build custom solutions. This capability ensures that data from different hardware components, irrespective of the manufacturer, can be collected and processed in a standardized manner without the need for further integrations, alignment, or harmonization.
Data querying with the Viam app
Once data is captured, the Viam app facilitates querying this data using common querying languages such as SQL or MongoDB’s querying language (MQL). On top of this, users can access sensor data or image metadata through API calls that can be made using Viam’s SDKs, command interface, or directly within the Viam app. This flexibility ensures that manufacturers can interact with their data in a way that suits their specific needs and workflows.
Visualization with third-party tools
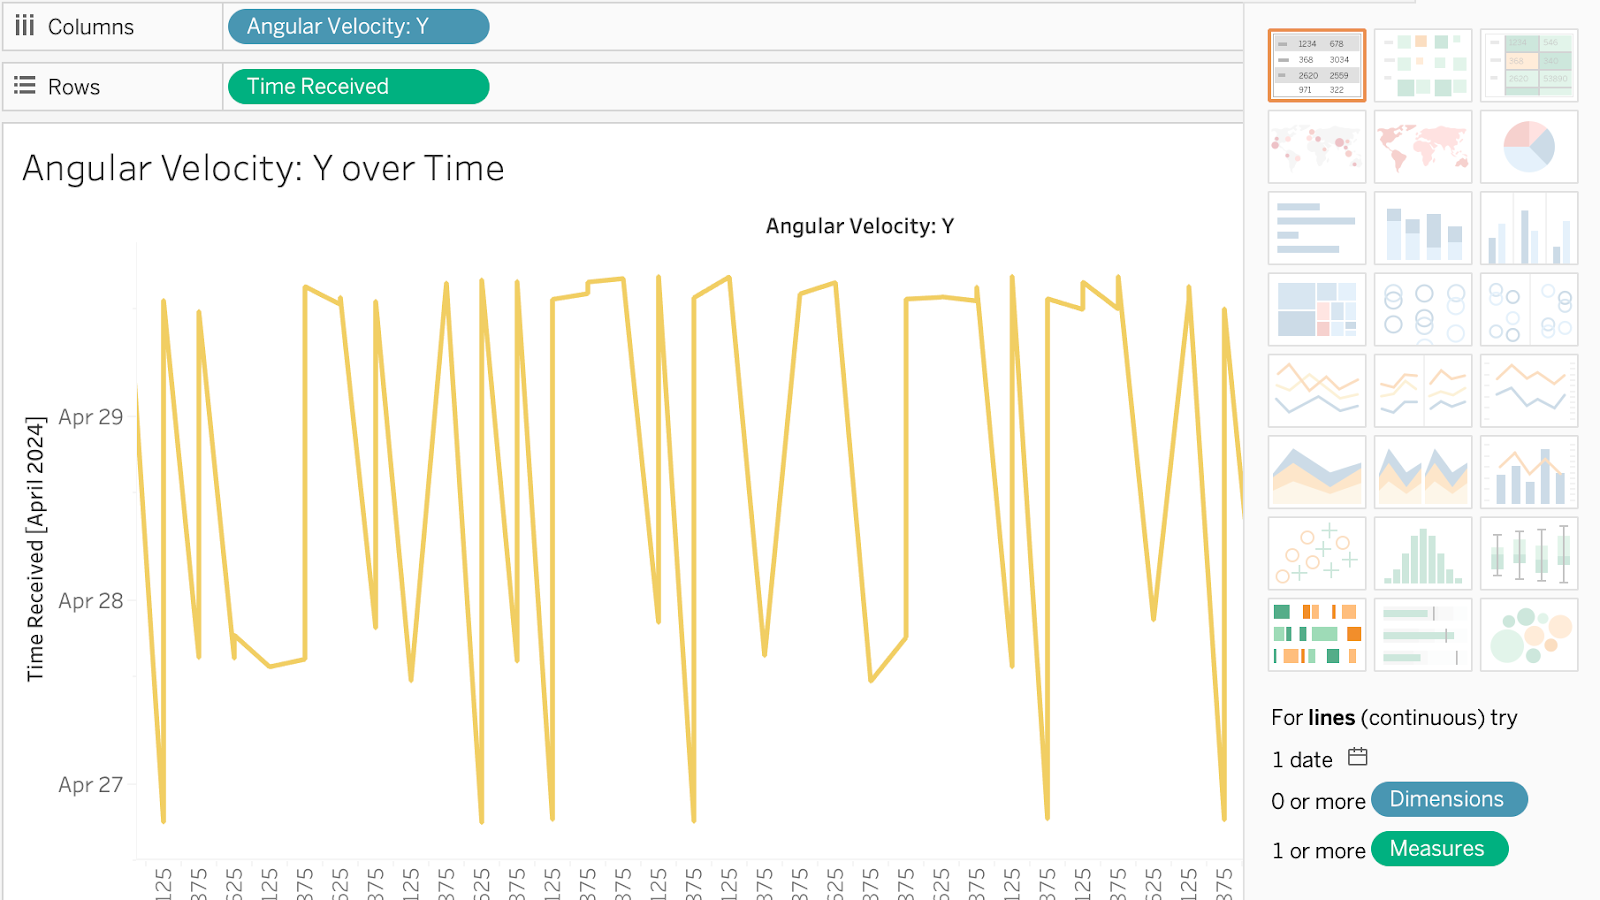
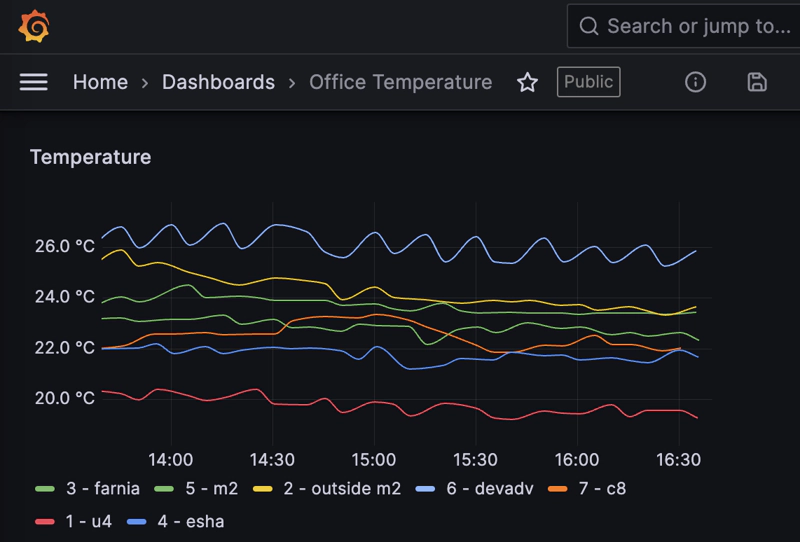
A significant advantage of Viam’s platform is its ability to easily integrate with any data visualization tool. After configuring data queries, users can visualize their data using a variety of third-party solutions, including Grafana, Tableau, and Google’s Looker Studio. These integrations allow for comprehensive visualizations that can encompass Viam’s detailed metadata captured from a single machine component, multiple components, or even multiple machines across a fleet. The ability to visualize data from a single pane of glass significantly enhances the ability to monitor and optimize manufacturing processes in real time.
Viam transforms the way manufacturers handle data integration and visualization, addressing the common challenges of data silos and complex system integrations. By providing an interoperable, out-of-the-box solution, Viam empowers manufacturers to take full control of their machine data, enabling real-time insights and more efficient troubleshooting and repairs. The platform’s comprehensive features, from data capture to querying and visualization, make it an indispensable tool for modern manufacturing operations looking to optimize performance and drive productivity.
In the following short video, developer advocate Arielle Mella shows how to use Grafana to visualize machine sensor data captured by Viam for getting a deeper understanding of how a machine is performing. Integrating with third-party tools like Grafana helps convert data into a digestible and easily actionable form that can help with use cases like detecting anomalies and carrying out preventive maintenance to avoid machine downtime.